

“I don't know what's going on inside the factory when I'm not there”
Production becomes unpredictable
Industrial IoT · Custom Built
LiveMach is an industrial IoT machine monitoring tool for Indian manufacturers. It uses its own sensor hardware and a cloud dashboard to show machine status, run time, downtime and OEE.
It is made for plant heads, production managers and factory owners. A small device fits outside each machine. Nothing inside is cut or rewired.
Running on 150+ machines at a ₹500+ crore manufacturer.
Schematic illustration of a factory floor: 24 machine tiles with live state indicators, connected through a gateway to the cloud. Most machines are running.
If any of these sound familiar, LiveMach was built exactly to solve them.
“I don't know what's going on inside the factory when I'm not there”
Production becomes unpredictable
“Night shifts are not serious”
Low output and supervision issues
“I don't know the actual run time and downtime of machines”
Hard to find why work is slow
“Production and forecasting are guess-based”
Cannot commit to bulk orders
“Registers and manual reports are never accurate”
Wrong data, wrong decisions, lost revenue
“I don't know my real power cost per machine or per order”
Pricing and margins are guesswork
“Breakdowns are found only after the machine stops”
Costly downtime and emergency repairs
Hardware
Interactive schematic of the LiveMach device board with nine labelled parts: the main controller, onboard memory, the isolation bank, the power section, field wiring terminals, the current sensor input, process sensor ports, status lights and the antenna area.
Software
Sensors read the machine · The LiveMach device logs and uploads, even offline · Live dashboard and alerts
Animated diagram: machine events flow from sensors through the LiveMach device and WiFi to the cloud dashboard. When the network drops, events are stored in the device own memory, then sync automatically once the connection returns, so nothing is lost.
Every machine event reaches the cloud as it happens.
Internet is down. The device keeps logging to its own memory.
Events are stacking up safely on the device. Nothing is lost.
Internet is back. Everything syncs on its own, automatically.
Everything your staff writes in registers today, the system records on its own. More accurate, and always ready when you need it.
Check factory status anytime, from anywhere
Know when and where time is being wasted
Correct salaries and incentives, based on real work
Easy decisions, backed by evidence
No fear in accepting big orders
Prevent the same breakdown happening again
No registers, no paperwork, no manual errors
Many machines today come with a PLC dashboard from the manufacturer, and factories pay a premium for it. It is a good tool. But it is built for engineers, not for the owner.
A PLC dashboard shows every technical detail of one machine: temperature, pressure, speed, alarm codes. That is what your maintenance team needs. It does not tell you how the business is doing. LiveMach is built for that. It sits above every machine, every brand and every plant, and turns the same activity into answers you can read in a minute, whether you are in the factory or not.
Made for
Machine maker dashboard
Engineers and maintenance staff who understand the machine
LiveMach dashboard
Owners, directors and plant heads. Your engineers get their detail too
What it shows
Machine maker dashboard
Technical readings of that one machine: temperature, pressure, RPM, alarm codes
LiveMach dashboard
What matters to the business: which machines ran, for how long, what was produced, who ran them and what it cost
Coverage
Machine maker dashboard
One brand, one machine type. Each manufacturer gives a separate dashboard with a separate login
LiveMach dashboard
Every machine of every brand and every age, across all your plants and warehouses, on one screen. Old mechanical machines included
Language
Machine maker dashboard
Codes, parameters and error numbers. You need an engineer to explain what they mean
LiveMach dashboard
Plain words: running or stopped, today's output, why it stopped. In English or Hindi
Where you see it
Machine maker dashboard
On the machine panel, or on a PC inside the plant
LiveMach dashboard
On your phone, wherever you are, even when you are travelling
History and reports
Machine maker dashboard
Live values for right now. Past data is limited, or someone has to export it and work on it
LiveMach dashboard
Shift, day and month reports ready on their own. Compare machines, lines and plants over time
People
Machine maker dashboard
The machine does not know who is running it
LiveMach dashboard
Operator, attendance, hours and efficiency, recorded against each machine
Money
Machine maker dashboard
No cost view at all
LiveMach dashboard
Power cost per machine and per order, so your quotes and margins stand on real numbers
Alerts
Machine maker dashboard
An alarm on the panel, seen by whoever is standing near the machine
LiveMach dashboard
An alert on your phone, with the reason and the history behind it
Technical logs
Machine maker dashboard
Yes, in full detail
LiveMach dashboard
Yes, kept as logs for the day your engineers need them. Readings from your existing sensors and controllers can be brought in as well
Your engineers keep the tools they already know. You get one simple view of the whole company, updated every minute, that opens from anywhere. Nothing you have already paid for goes waste.
Most factories still run on registers, whiteboards and Excel sheets. The entries are made by hand at the end of a shift, so they are late, incomplete and often just guessed.
LiveMach removes that step completely. The machine reports itself, every minute, with no one writing anything down. The dashboard then turns that raw data into the reports you actually use for planning, costing and salaries.
On paper, today
With LiveMach
To show how a rollout actually looks, here is a standard package we have already delivered for clients. We install LiveMach devices on 25 machines at your premises. Each machine connects to one central dashboard that gives you live data and clear insights.
A typical rollout: 25 machines.
Standard package · LM-25
Live Dashboard: see which machine is running or stopped, at any time
Analytics and Reports: track performance, efficiency and production data
Attendance Records: keep operator shift records without a register
Maintenance Management: schedule maintenance and keep service history in one place
Stoppage Reasons: record and study why machines stop
Engineer Visit Management: schedule and confirm engineer visits
Reminders and Notifications: alerts for maintenance, stoppages and other important events
This package scales to any machine count. You can also add the advanced add-ons below, based on what your factory needs.
Beyond core monitoring, LiveMach extends with advanced sensing and analytics. Each one is set up for your machines, your process and your cost structure.
See exactly how much power each machine draws. Find where energy is being wasted, and compare machines against each other, per machine or per line.
See exactly how much power each machine draws. Find where energy is being wasted, and compare machines against each other, per machine or per line.
Your real per-unit cost, combining power usage, run time and operator hours. Know your true cost before you quote a price.
Catch abnormal electrical load patterns that point to motor strain, imbalance or a coming failure, before it turns into a breakdown.
Pick up early signs of bearing wear, misalignment or mechanical stress from vibration, well before anyone on the floor can hear or see the fault.
Identify unusual sounds such as grinding, knocking or air leaks, which usually mean a mechanical problem is developing.
Power, current, vibration and sound readings are checked against thresholds we agree with you. You get an alert when a reading crosses its limit. AI based prediction is on the roadmap below. It is not live today.
Temperature, pressure, flow, proximity or any other parameter your process needs.
Illustrative oscilloscope simulation showing how current, vibration and sound signatures change when a fault develops. Not live data.
Signal normal. No anomaly detected.
No two factories run the same machines, the same process or the same cost structure. So we do not sell a one-size-fits-all box.
01
Our custom boards are fitted with the exact sensors your machines need. Current sensors, vibration sensors, microphones for sound, or anything specific to your process.
02
Sampling rates, thresholds and on-device logic are tuned for each machine type, so we capture the right signal without flooding your network.
03
The dashboard is extended with the metrics, reports and alerts that match your production goals. Power cost views, fault prediction views, or your own KPI reports.
04
We start with core monitoring on one machine or one line, check that the data is correct, then add the advanced features your team actually needs.
Already proven on textile looms, screen printing machines, and mixed electrical and mechanical plants.
The platform grows with you. As your needs change, we add AI-driven capabilities on top of the same hardware and the same dashboard, without starting again from zero.
Models running close to the machine catch developing problems earlier, predict when a failure is likely, and raise the maintenance work order on their own
Go beyond watching. Start, stop or adjust machines remotely, and let AI-detected patterns trigger the right response
AI-assisted study of your power usage to correct inefficiencies and manage demand, which directly cuts your electricity bill
AI-assisted tracking of tools, materials and spare parts, with reordering suggested in advance so critical items are in stock before you need them
AI-based detection of safety risks on the floor, with automatic alerts to protect your workers and keep records ready for audit
Connect production data with the systems you already run, such as your ERP, your accounting software or your existing machine controllers
More than one-time hardware. Subscription-based monitoring, analytics and support, so you get continuous insight without one large upfront cost
These are added selectively, based on what matters most to your business. Every roadmap is discussed and customised with you.
Case study
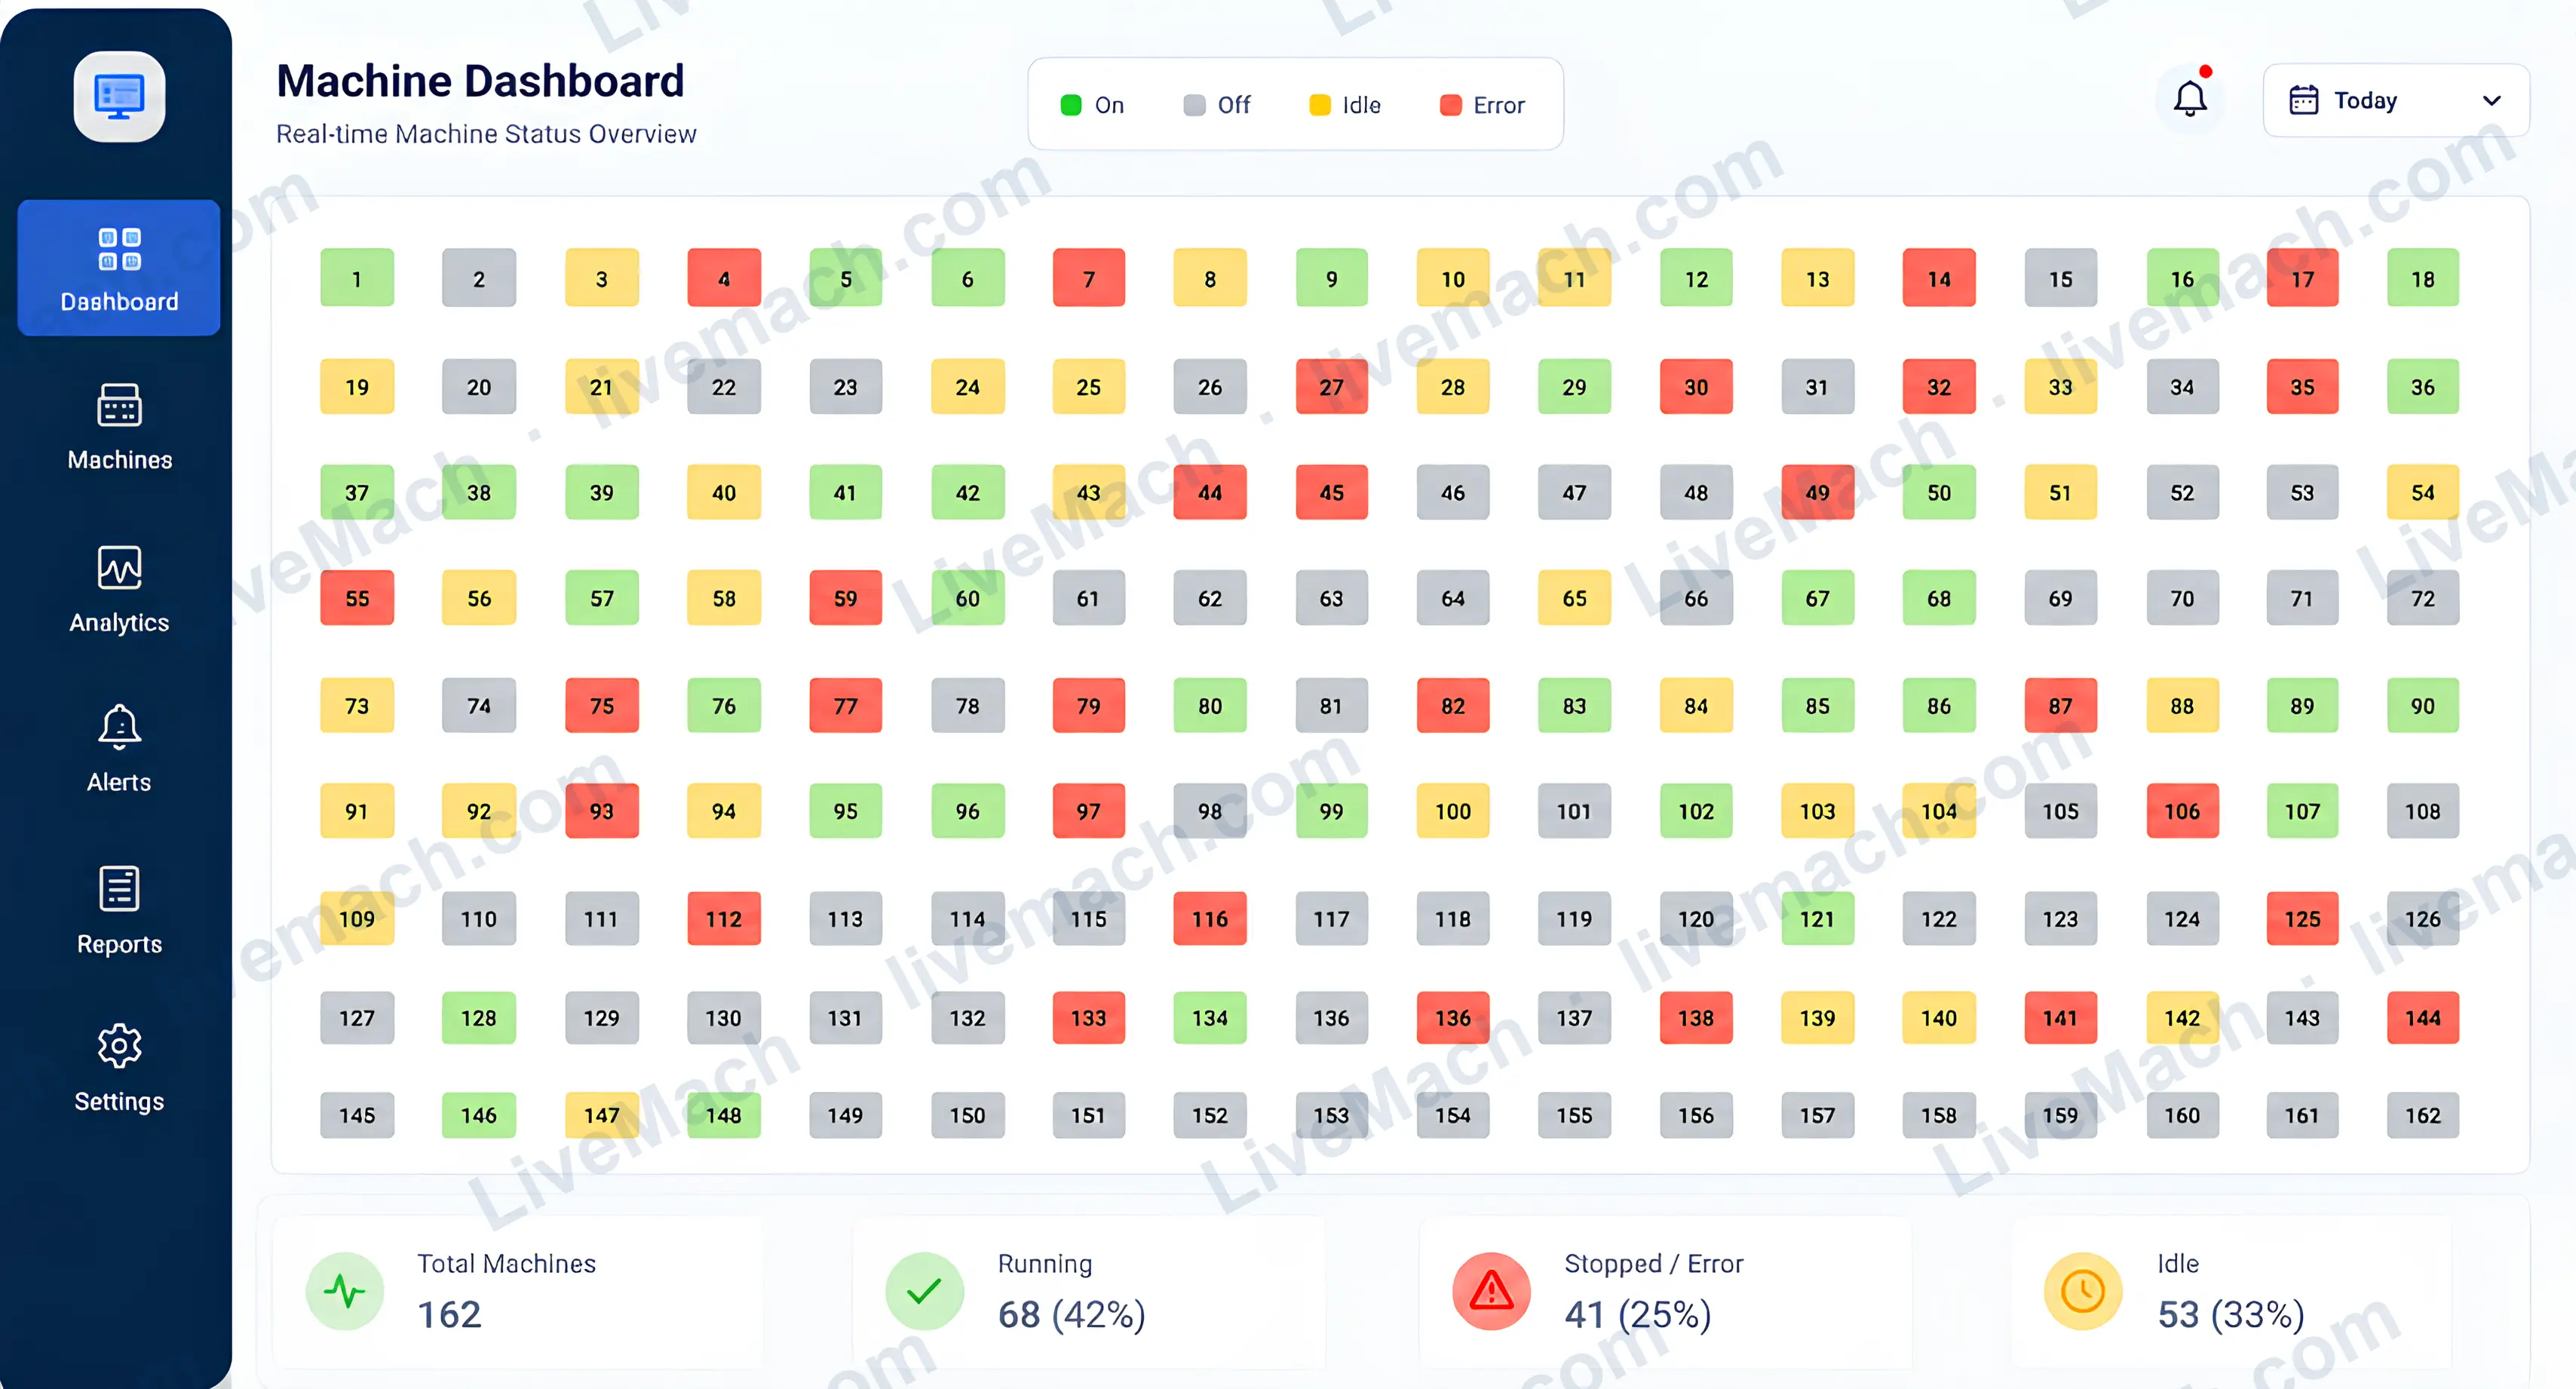
We built a complete industrial IoT platform for a ₹500+ crore manufacturer, from concept to reality. Hardware selection through to AI-powered cloud deployment, giving them live visibility across 150 machines.
Before this, the client was hesitant to commit to large orders. They had no clear picture of their actual machine uptime. We gave them a live machine tracking dashboard, laid out exactly the way their factory sheds are arranged, so every machine status is visible at one glance and stays monitored around the clock. With that clarity on uptime, they could estimate production confidently and commit to sales without guessing.
Machines Monitored
Productivity Gain
Uptime
up from 15–30%
Interactive before-and-after comparison: drag a divider across a schematic machine grid to compare a floor at 15 to 30 percent uptime with the same floor at 70 to 80 percent uptime after LiveMach.
Drag the divider to compare
Six machines, 24 hours. Watch the night shift.
Illustrative 24-hour activity strips for six machines. Before LiveMach: fragmented running time and a dead night shift. After: consistent running blocks around the clock, with aggregate uptime rising from roughly a quarter to over three quarters.
Aggregate uptime: 26%
Illustrative pattern based on typical deployments. Not client data. · Night shift, 10pm to 6am
Works on any machine, electrical or mechanical
No wiring or changes inside the machine
Quick installation
Supports multiple plants and sheds
Replaces manual registers with accurate data
Very easy to use, for everyone on the floor

CTO, AI Architect and Founder
7+ years building and scaling technology ventures across SaaS, ERPs, industrial IoT systems and AI automation. Co-founder of four companies, and led 70+ projects. Hands-on throughout, from custom IoT hardware and firmware on the factory floor to production-grade AI systems.
Visit fauzdar1.comTell us about your factory. We will get back to you within one working day.
The usual first step is a pilot on one machine or one line.